When a spreadsheet becomes a liability: the real cost of manual reporting

Most spreadsheets earn their keep. A workbook that tots up a quote, tracks who is on holiday, or models a job before it is priced is often the fastest, cheapest tool for the task, and there is no good reason to replace it. The one worth a second look is different. It started as one person’s calculator, then quietly grew into the monthly report that three people depend on. Nobody decided it should become infrastructure. It just did. That is the moment a spreadsheet stops being a convenience and starts being a liability, and it almost never announces itself.
The spreadsheet that quietly became infrastructure
Spreadsheets are not a relic. They remain a mainstay of how small businesses keep their numbers: in the UK government’s Longitudinal Small Business Survey, of the SME employers liable to file income tax self-assessment returns, 46% used spreadsheets for that record keeping in 2024, a share that has risen each year 1. For a great many tasks that is entirely sensible.
The trouble starts not with the tool but with the dependence. A workbook one person built to answer a question for themselves gets shared. Someone copies last month’s tab and updates the figures. A formula is dragged down, a column inserted, a total wired to a cell that moved. Over a year it becomes the thing the month-end pack is built from, the thing a pricing decision rests on, the thing nobody else quite understands. No one chose to put a business decision on a hand-maintained file. It happened one reasonable edit at a time.
Two costs build up inside that file as it grows. The first is the time it eats. The second is the errors it hides. Both are measurable, and both are worth sizing before deciding whether anything needs to change.
The first cost: the hours
Manual reporting is expensive mainly because skilled people do it. The work of gathering numbers from different places, pasting them into a workbook, reconciling them and formatting the result is slow, and it lands on exactly the people whose time is worth most.
In a survey of 200 finance chiefs across the US and UK, 41% of financial planning and analysis work was found to be manual, characterised as roughly 10 hours a week of skilled finance time spent on spreadsheet work 2. A separate survey of 500 professionals reported spending more than 9 hours a week transferring data from emails, documents and spreadsheets into their systems 3. That second figure is US data, so it is best read as a proxy rather than a UK measurement, but the order of magnitude is the point: roughly a day a week, per person, disappearing into moving and reconciling numbers by hand.
Most of that time is not analysis. It is gathering: finding the figures, lining them up, checking they tie out. The thinking, the part the skilled person is actually paid for, happens only once the wrangling is done. When a business says it has no time to look ahead, this is often where the time went.
The second cost: the errors
The more uncomfortable cost is accuracy, and it needs stating carefully because the headline number is widely misused. Across seven field-audit studies covering 88 spreadsheets, 94% were found to contain errors 4. A 2024 academic review restated the same finding for spreadsheets used in business decision-making 5. Read carelessly, that sounds like proof every spreadsheet is dangerous. It is not.
The honest reading is about size, not danger. The error rate per individual cell is low, a few percent. The 94% headline falls out of large spreadsheets simply having a great many cells: with enough formulas, the odds that at least one is wrong climb towards certainty. A twelve-cell holiday tracker is fine. A four-thousand-row, hand-updated month-end pack is where the maths turns against the file. The question for a big, hand-maintained workbook is not whether it contains an error but how many, and whether any of them sit somewhere that matters.
What that looks like when it goes wrong
The mechanism is easiest to see in cases large enough to have been investigated, with the caveat that these are major institutions, not small firms. They illustrate how a manual step fails, nothing more.
In 2013, two economists, Reinhart and Rogoff, published a finding that high public debt coincided with negative growth, a result cited in austerity debates. When other researchers obtained the workbook, they found a range in one formula that did not select the whole row, omitting five of the twenty countries. Corrected, the reported -0.1% growth became +2.2% 6. A single mis-set range changed the conclusion.
The year before, JPMorgan lost around 6.2 billion dollars in the episode known as the London Whale. Part of the risk model was run as a chain of Excel sheets with figures copied by hand between them, and one step divided by a sum where it should have divided by an average, understating the risk being carried 7. The loss had many causes, but a manual copy-paste between workbooks sat inside it.
Neither case is a small business, and neither is a prediction. They matter because the mechanism is exactly the one in the SME month-end pack: a formula that does not quite cover what it should, a number pasted into the wrong place, no second pair of eyes to catch it before a decision is made.
Sizing the cost
The two costs can be set side by side, with the time cost the easier of the two to picture.
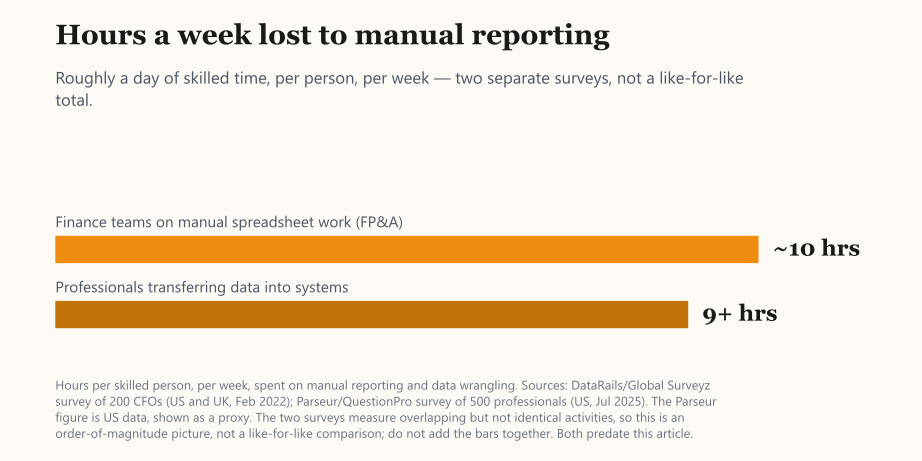
Hours per skilled person, per week, spent on manual reporting and data wrangling. Sources: DataRails/Global Surveyz survey of 200 CFOs (US and UK, Feb 2022); Parseur/QuestionPro survey of 500 professionals (US, Jul 2025). The Parseur figure is US data, shown as a proxy. The two surveys measure overlapping but not identical activities, so this is an order-of-magnitude picture, not a like-for-like comparison. Both predate this article.
The chart shows roughly a day of skilled time a week going into manual reporting and data wrangling, from two separate surveys. It is deliberately an order-of-magnitude picture, not a precise comparison: the two surveys measured overlapping but different activities, drew on different samples in different years, and one is US data. The bars should not be added together. What they share is the shape of the problem, and it is a familiar one to anyone who has watched a capable person spend a morning rebuilding a report.
When a spreadsheet is still exactly right
None of this is an argument against spreadsheets. For a large class of jobs they remain the right tool, and replacing them would only add cost and rigidity for no gain. A spreadsheet is still exactly right when it has a single owner who built it and understands it, when the stakes of an error are low, when the structure is stable rather than growing each month, when anyone could check the result in a few minutes, and when nothing irreversible rests on the number it produces. A pricing sketch, a one-off model, a personal tracker: keep them.
The line is not about spreadsheets being good or bad. It is about shared dependence and consequence. A workbook only one person relies on, for something easily reversed, is a tool. The same workbook, once several people depend on it for a decision that is hard to undo, has quietly become infrastructure, and it deserves the scrutiny any other piece of infrastructure would get.
Knowing which side of the line you are on
The useful exercise is short, and it can be done today without changing anything. For the workbook that runs a real part of the business, four questions sort it:
- How many people depend on this file, and what happens to them if it is wrong?
- What actually breaks if a single number in it is off, and how far would that travel before anyone noticed?
- How long does it take to re-run from scratch, and how much of that time is a skilled person gathering rather than thinking?
- Could anyone other than the person who built it spot an error in it?
A file that comes through those questions cleanly is fine; leave it be. A file where a wrong number would reach a decision, where re-running it costs most of a day, and where only one person could ever catch a mistake, has crossed the line from convenience to risk. That is the point at which moving the reporting onto something built for the job, with the gathering automated and the figures checked as they flow, stops being over-engineering and starts saving both the hours and the worry.
The site goes deeper into that on the data and reporting pages, where hirevolution sets out how it approaches taking manual reporting off a workbook and onto something dependable.
Sources
- UK Department for Business and Trade, Longitudinal Small Business Survey 2024: SME employers (1 to 249 employees), Wave 10 (8,396 SME employers). 46% used spreadsheets for income tax self-assessment record keeping in 2024. [link]
- DataRails / Global Surveyz survey of 200 CFOs (US and UK), February 2022. 41% of FP&A processes are manual, characterised as around 10 hours a week of skilled finance time on spreadsheet work. [link]
- Parseur / QuestionPro survey of 500 US professionals, July 2025. Respondents reported spending more than 9 hours a week transferring data into digital systems (US data, used here as a proxy). [link]
- Raymond R. Panko, ‘What We Know About Spreadsheet Errors’ (2008 revision). Across 7 field-audit studies (88 spreadsheets, post-1995 methodology), 94% contained errors; per-formula error rates run at a few percent (Powell, Baker and Lawson, 2009, around 1%). Panko’s compilation restated by i-nth, ‘Your spreadsheets are wrong’. [link]
- Poon et al., Frontiers of Computer Science (2024), DOI 10.1007/s11704-023-2384-6. A literature review restating that 94% of spreadsheets used in business decision-making contain errors (reported by Phys.org, 13 Aug 2024). [link]
- Borwein and Bailey, ‘The Reinhart-Rogoff error, or how not to Excel at economics’, The Conversation, 22 April 2013. A range that omitted five of twenty countries turned a reported -0.1% into a corrected +2.2%; error identified by Herndon, Ash and Pollin (UMass Amherst). [link]
- JPMorgan ‘London Whale’, 2012: within a roughly $6.2bn trading loss, a risk model run as a chain of Excel sheets with manual copy-paste divided by a sum instead of an average, understating risk. The JPMorgan Management Task Force Report on CIO Losses (2013) records that ‘after subtracting the old rate from the new rate, the spreadsheet divided by their sum instead of their average’; quoted and sourced to the report by thekeycuts.com. [link]